

The idea of returning production in college football is easy enough to understand: The more continuity and experience you return from last season, the more likely you are to improve. It’s how things have always worked, but is that still true in 2026, with the transfer portal and extreme player movement dominating the sport?
Yes. To a degree. It’s still better to return a lot of your production than a little, even if last year’s headliner bombed. Clemson led the nation in returning production heading into 2025, which furthered the idea that a potential rebirth was coming to Death Valley East. But a combination of injuries, tactical stagnation and disappointing development held back the Tigers, and they slipped from 10-4 and 22nd in SP+ to 7-6 and 34th.
Most of the rest of the top 10, however, fared well. Texas Tech (sixth in returning production) charged from 54th to third and won its first Big 12 title. Kennesaw State (fifth) went from 132nd to 89th and won Conference USA in its second FBS season. Vanderbilt (third) won 10 games and improved from 52nd to 11th. Oklahoma (10th) and Texas A&M (seventh) went from 14 combined wins to 21 with a pair of playoff berths. In all, despite disappointments such as Clemson and Baylor, the top 10 in returning production improved by an average of 1.0 wins and 6.4 spots in SP+. And of the teams at the bottom of the list — specifically, the 15 squads with 36% returning production or less — 10 regressed, and eight fell by at least 11 spots in SP+. Western Michigan (128th in returning production) got hot late in the season to rise from 6-7 to 10-4, and Utah State (133rd) improved as well, but the trends remained clear.
So, the concept of returning production is still good, even if ranking at the top or bottom of the list doesn’t guarantee improvement or regression. With the season’s lone transfer window closed and 2026’s rosters at a semi-stable point, let’s see what this all means for 2026.
Returning production percentages
Here are the returning production percentages and rankings for all 138 FBS teams for 2025. (Yes, we’re up to 138. Hello, North Dakota State and Sacramento State!)
How SP+ accounts for transfers
Incredibly, transfers have increased by 64%, from 13.9 per team (14.2 not including service academies) to 22.8 (23.3), in just the past two years.
When I release 2026’s initial SP+ projections later in the week, you’ll see that the weight recruiting rankings carry in the projections has diminished significantly — we live in a portal-dominated universe, and transfers are accounted for in a couple of ways. First, to the degree that recruiting rankings are still involved, the rankings of transfers are vastly important. But second, and more importantly, your new players’ previous production is folded into the returning production formula.
I mash an incoming player’s production from his previous team into the numerator and denominator for his new team. (Because the translation in moving from the lower levels of the sport to the FBS is extremely inconsistent, I give only half-credit for players transferring up from lower divisions.) So, if your quarterback leaves, and you bring in a transfer who was productive elsewhere, that dampens the blow of your QB leaving.
So really, we’re talking about returning and incoming production here. I fiddled with the concept of splitting the two for SP+ projections, looking at both separately, but I didn’t find an approach that made the projections more accurate. So, we move forward with an approach similar to that of years past.
Here is the current weighting for determining the offensive percentages above:
-
Percent of returning OL snaps: 39.6% of the overall number
-
Percent of returning WR/TE receiving yards: 35.0%
-
Percent of returning QB passing yards: 22.3%
-
Percent of returning RB rushing yards: 3.1%
Breaking things out by position is a bit trickier on defense, where units aren’t as strictly defined, and the percentage of returning production is derived from position units and types of stats. We instead lean more on types of production than positions:
-
Percent of returning snaps: 65.9%
-
Percent of returning tackles: 19.2%
-
Percent of returning tackles for loss: 14.9%
(Note: Because NDSU and Sac State played at the FCS level in 2025, I didn’t have full snap-count data for them. I used an estimated number of O-line snaps based on each player’s number of starts and game participation, and I used an estimated number of defensive snaps based on each player’s tackle totals.)
Returning production is lower than ever in 2026
Even though I incorporate incoming players’ stats into the formula, the extreme rise in transfers is dragging down returning production averages pretty significantly. A quick example shows you why: If your starting quarterback returns, you might return close to 100% of your passing yardage from last season. But if you lost a 3,000-yard passer and brought in someone else’s 3,000-yard passer, that means you return only 50% of yardage — 3,000 divided by (3,000 + 3,000).
Returning production reached an all-time high in 2021 after the NCAA gave everyone involved in the 2020 COVID season an extra year of eligibility; the national averages were always going to slide in the following seasons as the bonus-year guys filtered out of the playing pool. But instead of regressing toward the pre-COVID mean of around 62%, we’ve slid way past that.
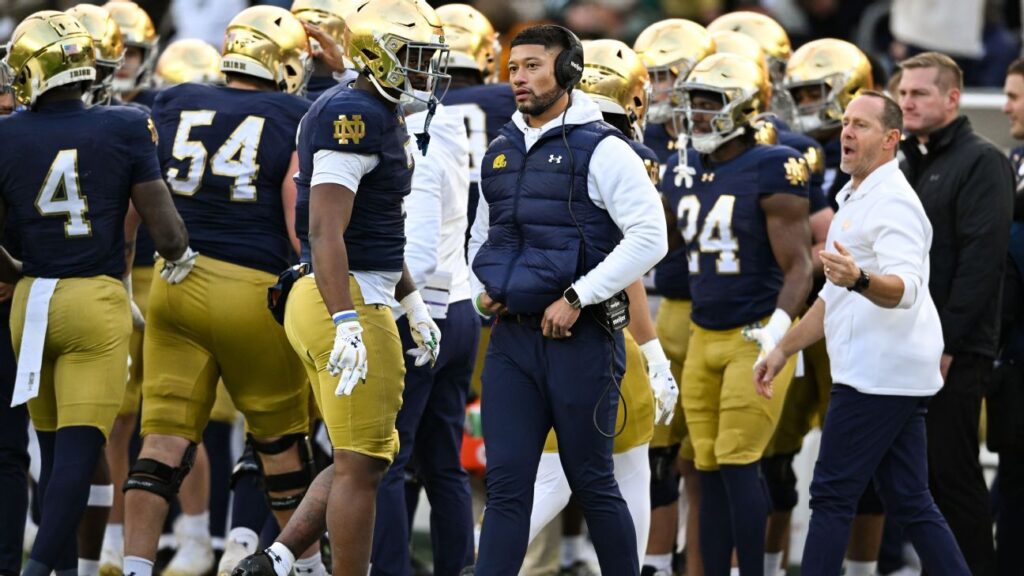
Notre Dame might lead the nation in returning production this season, but the Fighting Irish’s 72% would have ranked 14th in 2024. It would have ranked only seventh last year. So, though these numbers will provide a boost to their SP+ projections, along with those of Maryland, Nebraska and others near the top of the list, the impact won’t be as significant as when Iowa State led the nation with 86% two years ago (and jumped from 7-6 to 11-3). Then again, Notre Dame finished last season fifth in SP+; the Irish won’t have to improve much to become serious national title contenders.
Of course, the national average tells only so much of a story. With transfers filtering upward so dramatically in the transfer portal, from the Group of 6 conferences (or lower) to the Power 4, it probably isn’t surprising to see that the power conferences are faring far better in the returning production department.
2025 returning production averages by conference
-
Big Ten (59.2%)
-
SEC (58.2%)
-
Big 12 (56.7%)
-
ACC (55.3%)
-
Pac-12 (51.0%)
-
Conference USA (48.0%)
-
American (46.0%)
-
Mountain West (45.4%)
-
MAC (41.6%)
-
Sun Belt (40.7%)
In all, P4 schools average 58% returning production, while the G6 averages 45%. Only one G6 team made the returning production top 20, and even Florida Atlantic, at 19th, barely made it.
The food chain is what it is, and though a lot of G6 teams will fare well in pulling up stars from FCS or lower, again, you get only half-credit for the production of sub-FBS players.
Most likely to improve in 2026
Because of the aforementioned food chain, we have 11 teams that both (a) ranked in the SP+ top 30 last season and (b) currently rank in the returning production top 20. The rich are evidently getting richer in terms of known production.
Notre Dame, BYU and Texas. These were the top three teams to miss last year’s College Football Playoff, finishing 11th through 13th in the final CFP rankings. All of them are loaded heading into 2026, though via different means.

Notre Dame returns quarterback CJ Carr, plus last year’s most frequent target Jordan Faison, players responsible for 42 of 60 offensive line starts, and 14 of the 21 defenders who recorded at least 200 snaps. Marcus Freeman also added four defenders who had 200-plus snaps elsewhere, led by Pitt defensive tackle Francis Brewu and Colorado cornerback DJ McKinney. (The Irish lost two stud running backs in Jeremiyah Love and Jadarian Price, but as you see above, turnover at running back doesn’t tend to make as much of an impact as at other positions.)

BYU skewed more toward continuity: The Cougars return last year’s quarterback (Bear Bachmeier) and running back (LJ Martin), plus half their offensive line starts and 10 of 16 200-snap defenders. Kalani Sitake did a nice job of adding experience to the offensive line, too, with Utah State tackle Jr Sia plus part-time starters from Washington (Paki Finau) and Stanford (Zak Yamauchi).

For Texas, however, it was more about leaning into portal additions to complement returning quarterback Arch Manning. Steve Sarkisian loaded up in the skill corps, with running backs Raleek Brown (Arizona State) and Hollywood Smothers (NC State) and receivers Cam Coleman (Auburn) and Sterling Berkhalter (Wake Forest). He also added seven other players who started at least six FBS games last season. There’s a decent amount of turnover on the roster, but pure experience won’t be an issue.
Georgia, Oregon, Texas Tech, Texas A&M and Oklahoma. That’s right, almost half of last year’s CFP teams also rank in the returning production top 20, though finalists Indiana (52nd) and Miami (78th) got hit at least a bit by attrition. Georgia (Gunner Stockton), Oregon (Dante Moore), Texas A&M (Marcel Reed) and Oklahoma (John Mateer) all return their starting quarterbacks, and though Texas Tech lost Behren Morton, that loss was dampened by the addition of one of the most statistically prolific QBs in the portal in Cincinnati’s Brendan Sorsby. That could be a theme for 2026: After so many top teams headed into 2025 with new starting QBs, experience levels at the most important position on the field should be much stronger this season, at least among power conference programs.


USC and Michigan. Granted, Michigan has a new head coach in Kyle Whittingham, but these two teams return strong levels of experience (and starting QBs) from last year’s intriguing but merely solid squads. Expectations will be pretty high, especially for USC.

Washington. One of the more dramatic stories of this year’s portal window involved Washington’s Demond Williams Jr., who entered the portal and then announced he was returning to UW two days later, following outcry, and announced legal challenges. Assuming no locker room issues, he will now lead an experienced team that returns four offensive line starters and has added solid experience from the portal, especially on defense.
Most likely to regress in 2026
If a healthy percentage of last year’s top teams returns solid levels of experience, that means the teams that don’t could suffer a decent amount. Here are the eight teams that (a) ranked in the SP+ top 40 last year and (b) currently rank in the triple digits in returning production. Five of them lost their head coaches — and quite a bit of their two-deeps — to schools higher up the food chain.

Iowa State. ISU underwent quite the roster transfusion after losing coach Matt Campbell to Penn State and replacing him with Washington State’s Jimmy Rogers. Among the 55 outgoing transfers were 23 who followed Campbell to State College; meanwhile, among the 47 incoming players were 15 former Wazzu Cougars. I like quite a few of the players Rogers added — quarterback Jaylen Raynor (Arkansas State) is experienced, slot man Omari Hayes (Tulane) should be immediately reliable and Wazzu defensive end transfers Isaac Terrell and Malaki Ta’ase are major disruptors — but this amount of turnover will almost always produce poor returning production numbers, especially considering Rogers also brought in 15 players from sub-FBS schools.
Memphis, South Florida and North Texas. Three of the American Conference’s top programs all lost head coaches and truckloads of players to power-conference teams.
Memphis lost coach Ryan Silverfield to Arkansas and exchanged 49 outgoing transfers, including seven to Arkansas, for 53 incoming transfers, including 17 from new coach Charles Huff’s last employer, Southern Miss*. USF lost Alex Golesh to Auburn and traded 33 outgoing transfers (13 to Auburn) for 41 incomings. And of this trio, North Texas got hit worst: Eric Morris went to Oklahoma State and 16 players followed him, including stars in quarterback Drew Mestemaker, running back Caleb Hawkins and receivers Wyatt Young and Miles Coleman.
(*No one fared worse than Southern Miss in the returning production game. By current calculations, the Golden Eagles’ 22% production is the worst in recent memory. Huff brought tons of production with him from Marshall last season, then left with a lot of it a year later.)

James Madison. JMU is one of the most sturdily built G6 programs on average, but the Dukes got waylaid in the hires-and-portal game. Bob Chesney left for UCLA, and 10 JMU players followed him, but it didn’t stop there: JMU’s recent success made their players very attractive, and nine other Dukes also left for power conference rosters.

Vanderbilt. After winning 10 games for the first time last fall, the Commodores are starting over. Sparkly new blue-chip quarterback Jared Curtis has come aboard, but whoever starts at QB will be one of 14 new Commodore starters. Curtis’ addition suggests VU’s future is in good hands, but 2026 should be a transition year of sorts.

Iowa. Kirk Ferentz will also be breaking in 14 to 15 new starters in 2026, and though I admire the way he leaned into adding smaller-school stars with multiple years of eligibility remaining — especially running back L.J. Phillips Jr. (South Dakota Coyotes), defensive end Kahmari Brown (Elon) and safety Anthony Hawkins (Villanova) — the returning production formula isn’t designed to reward that. We might see a bit of a reset in 2026 before the strategy fully pays off.

East Carolina. ECU held on to head coach Blake Harrell after its first nine-win season in 12 years, but the portal was still pretty unforgiving. The Pirates lost starting quarterback Katin Houser (Illinois), running back London Montgomery (Florida), offensive tackle Jimarion McCrimon (NC State), guard Emmanuel Poku (South Carolina), defensive tackle Zion Wilson (Virginia), safety Ja’Marley Riddle (Georgia) and corner Jordy Lowery (Florida) to the power conference ranks. That’s tough.